
November Update


Mark Berube, ChFC, CLU · Nov 11, 2026
ETH is down. Here are the numbers first, before anything else.
We measured every ETH rally since 2016. Every big multi-leg rally since 2019 had the same shape: jump, rest, jump. A first leg up, a pullback of 21% to 27%, then a second leg larger than the first. We identify the rest as a bear trap: the drop that shakes sellers out before the second leg.
The current run started at the June 25 low of $1,565 and rose 77% to $2,776 on Sep 21. At $2,082, ETH is 25.0% off that peak, inside the $2,015 to $2,204 zone where all four past rests ended. This rest is running long, like the slower 2022–24 run.
We read it like a traffic light, on the daily close:
Where we are: yellow. A bear trap is only confirmed in the rear-view mirror. Our Bear Traps letter explains how they work.
While price rested, the numbers underneath kept going up.
Put simply: AI agents pay in stablecoins. Stablecoins move on Ethereum. The law for stablecoins starts Jan 18. And more ETH is being locked up in staking every quarter.
A bear trap is a fake breakdown. Price falls far enough to convince you the bottom is gone. You sell to protect yourself. Then it turns and runs higher without you.
The "bear" is the investor betting on lower prices. The "trap" is that the drop was the bait.
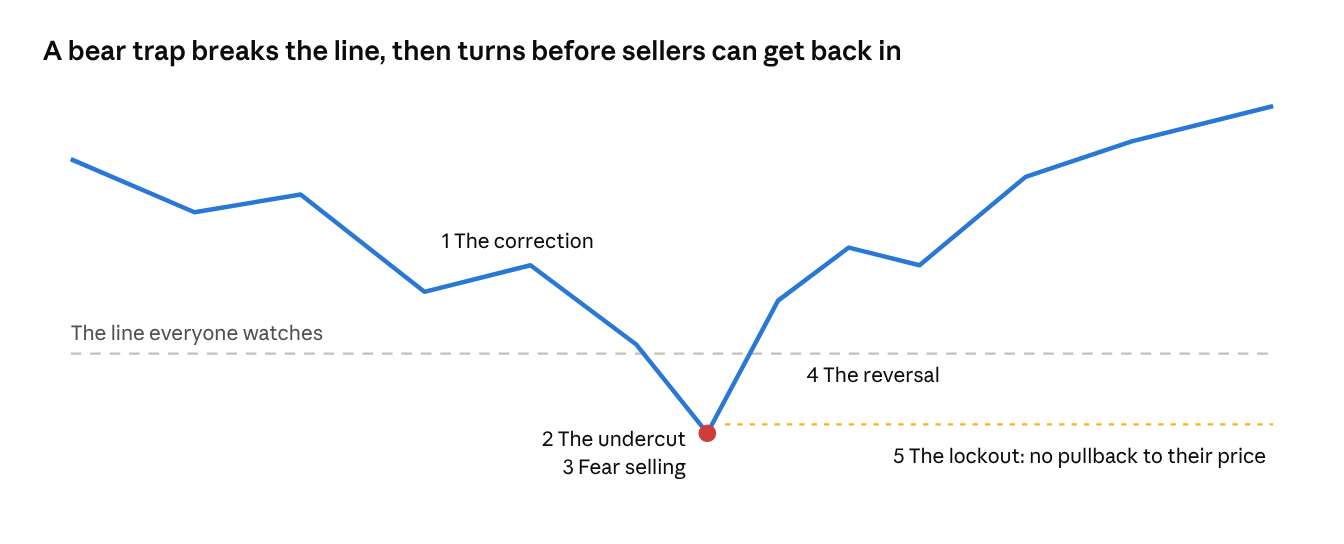
The whole trap is in one picture: the break below the line is the bait, and the sellers' price is never offered again.
Not every break is a trap. Long, painful declines come from deeper problems, like a bubble or a credit crisis. Traps come from scares.
A bear trap can only be confirmed in the rear-view mirror. While it's happening, it looks exactly like a real breakdown. Nobody rings a bell.
Pattern recognition doesn't tell you the day it turns. It gives you a plan made in calm markets: where past rests have ended, and the level that would prove the pattern wrong. That is why our ETH read is a traffic light. Yellow is the rest, the zone where traps are built. Red is the line we set in advance. Everything in between is noise.
The same pattern can show up in interest rates. Our read: the bond market may be setting one right now.
October's inflation report came in hot. Consumer prices rose 0.4% versus 0.3% expected. Core prices, which leave out food and energy, rose 0.3% versus 0.2%. A Federal Reserve governor said a reading like this puts a half-point rate hike on the table for December.
The bond market reacted right away. The 10-year Treasury yield jumped 11 basis points to about 4.76%. The 2-year jumped about 18. When short-term rates rise faster than long-term rates, the market is pricing in a Fed hike before the Fed acts. The bond market is doing the Fed's tightening for it.
The two forces that pushed inflation up this year were oil and AI. Both are now going the other way.
The market agrees. The inflation swap market prices inflation at about 2.07% a year from now, basically the Fed's 2% target.
The U.S. owes about $40 trillion. A Treasury carrying that much debt can't afford a decline in growth, and its actions say so.
In plain terms: Treasury is not flooding the market with long bonds, and it is buying some back. That works against rates running away.
From here to the Fed meeting is about four weeks. If yields peak around the meeting, the scare plays out in roughly one to three weeks, the classic bear-trap window.
The rear-view mirror rule still applies. We won't know this was a trap until it's over. What we do know is the pattern: fear peaks when the news is fully known, and the investors who sell into it are the ones left on the sidelines when it turns.
Sources for this section: CNBC on October CPI; MLQ on the Fed governor's half-point comment; Bloomberg's Anna Wong on the CPI details; Treasury and press links above.
Here is this whole letter, explained so a 12-year-old can follow it.
The price. ETH's price went down about 24% in five weeks. That's the part everyone sees.
The pattern. ETH's biggest climbs come in two jumps with a rest in between: jump, rest, jump. ETH made its first jump this summer. Now it's resting. In the past, the second jump was the bigger one. We use a traffic light to tell where we are. Right now it's yellow, which means wait.
The math. Think of Ethereum as a highway for money.
The bear trap. Imagine everyone says the ice cream truck isn't coming, so kids leave the line. Then the truck shows up, and the kids who left are now at the back. Selling during a scare is leaving the line right before the truck arrives.
The bonds. Grown-ups got worried that prices are rising, so interest rates jumped. But the two things that pushed prices up, gas and computer parts, are getting cheaper. And the government owes so much money that it doesn't want rates running too high. So the scare may be bigger than the problem.
What we do. We don't sell good things at scary prices. We watch the math, and we watch the light.
Questions? Email us at info@patriotadvisory.com.
Mark Berube, ChFC, CLU · President, Patriot Advisory Group LLC (dba Quantum Capital)
Important disclosures. This letter is prepared by Quantum Capital, a doing-business-as name of Patriot Advisory Group LLC, a registered investment adviser with the State of New Hampshire. It is provided for informational and educational purposes only and does not constitute investment advice, a solicitation, or an offer to buy or sell any security. References to specific securities, instruments, or asset classes are for illustrative purposes and do not represent a recommendation. All investing involves risk, including possible loss of principal. Digital asset markets are highly volatile and subject to regulatory uncertainty. Past performance is not indicative of future results.
This letter contains forward-looking statements, which are opinions and not guarantees. Third-party data is believed to be reliable but is not guaranteed. Prices cited are as of the dates shown.
Pattern figures use Coinbase ETH-USD daily closes. Historical patterns describe the past, four or five cases is a small sample, and patterns can fail. Patriot Advisory Group, its principals and its clients hold ETH and Ethereum-related securities and may buy or sell them at any time.
Position disclosure. I own shares of BitMine Immersion Technologies (BMNR).
Registration does not imply a certain level of skill or training. Our Form ADV is available on request. Please consult your investment adviser regarding the suitability of any investment for your specific situation.
RIA Registered State of NH